
Prev: Paired t-test | Next: Chi Square test
One sample t-test
What is the one sample t-test
- One sample t-test is the type of t-test that we apply when we want to explore whether the mean of our sample is significantly different from a specific value which usually is the known mean (and standard deviation) of the population.
Examples:
- In educational research: suppose you have a class of students learning mathematics with a specific innovative method. Use one sample t-test to identify whether the mean value of their performance in a standardized knowledge test is significantly different compared to the mean value of performance for all other students who have taken this test in the past.
- In elearning: suppose you offer an online course which has been offered also in the past but now has been redesigned as a gamified learning environment for the first time. After the course you run a reliable and validated knowledge test to measure learners' performance. Apply one sample t-test to investigate whether the mean of the gamified version is significantly different compared to the mean of learners' performance when delivering the course in the past.
- The null hypothesis of a one sample t-test assumes that there are no statistically significant differences between the examined sample mean and the known population mean.
- The t statistic computed at one sample t-test is the following:
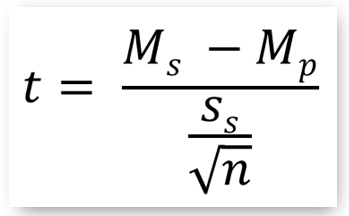
where:
- Ms : the mean of the sample (the examined value)
- Mp : the mean of the population (the known and expected value)
- ss : the standard deviation of the sample
- n : the sample size.
A one sample t-test scenario
- A group of students studying in a multimedia environment with background music have achieved a mean score of 76.625. We run a one sample t-test to identify whether this mean is statistically significant compared to 70.00 which is the mean score that students of the same profile achieve in this standardized knowledge test.
Read data
In [6]:
import pandas as pd
import scipy.stats as stats

data = pd.read_excel('../../data/researchdata.xlsx', sheetname="ttest-indep")
print(data.Treatment.head(),'\n')
print(data.Treatment.describe())
Apply t-test
- Check for normality
In [7]:
stats.shapiro(data.Treatment)
Out[7]:
- Call stats.ttest_1samp() with 70.00 as population mean value.
In [10]:
t, p = stats.ttest_1samp(data.Treatment, 70.00)
t, p
Out[10]:
Interpretation of results
- The p value returned (0.0006) is lower than threshold 'a' (0.05). Thus the null hypothesis is rejected and we argue that sample mean performance is significantly different (improved) compared to the general mean performance of students who have taken this test in the past.

Copyright
 . Free learning material
. See full copyright and disclaimer notice