Prev: Descriptive statistics | Next: Paired t-test
t-Test (independent samples)
What is the t-test
- The t-test (or Student's t-test) is a widely applied statistical control and the reason is simple: based on the outcome of a t-test researchers can provide an answer to the question 'does an independent variable (IV) have an impact on a dependent variable (DV)'?.
- t-Test for independent samples compares the mean values of two samples which are independent; that is, performance of one sample does not affect the other.
The t-Test computes the following general statistic:
              signal              Difference of Means
      t = ---------------- = -----------------------------
              noise                  Standard Error
- Suppose we have two samples of the same size n1 = n2 = n having mean and standard deviation: M1, s1 and M2, s2 respectively. Then the t-test for these independent samples is computed as:
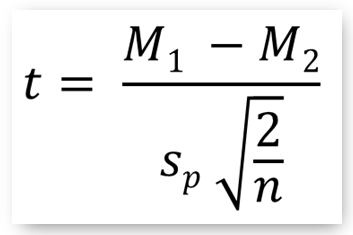
...where sp is the pooled (or composite) standard deviation of the two samples.
- For more on t-test mathematical formulae you may read the detailed t-test article @ wikipedia
t-Test conditions and Criteria
Be warned that the above formula is valid when:
- The sample sizes are the same: n1 = n2 = n
- The populations (where the samples come from) follwo the normal distribution (normality criterion), and
- The variances of the populations are also the same (variety criterion)
When the above do not hold true then adjustments or even totally different statistical controls apply as we explain further below.
A t-test scenario in e-learning
- Background music is sometimes integrated in e-learning software and it is expected to positively stimulate the learners. But, does really background music has a beneficial impact on learning?
- To answer the question a researcher may set up the following experiment:
- IV: Background music with two conditions: (a) BM is supplied, (b) BM is not supplied
- DV: Level of student learning as measured by their performance in a reliable and validated test (continuous variable, scale 0-100)
- Population: students of specific age and prior knowledge studying in a multimedia elearing environment
- Research Design: Two groups post-test only design
- Groups:
- Control (C-group): N1=38 students (randomly selected) studying without background music
- Treatment (T-group): N2=40 students (randomly selected) studying with background music
- Null hypothesis H0 = "Students studying with background music will perform the same compared to students studing without background music" (non-directional)
Read data
In [1]:
import pandas as pd
import scipy.stats as stats

data = pd.read_excel('../../data/researchdata.xlsx', sheetname="ttest-indep")

data.tail()   # see the last 5 lines: 'NaN' is inserted in missing values of C-group
Out[1]:
Some descriptive statistics
In [2]:
print(data.Control.describe())
print('\n')
print(data.Treatment.describe())
Apply t-test
1. Check for Normality & Variance criteria
- The first step when applying statistical controls is to check the normality and variance criteria
- (a) Normality
- To test for normality, apply the Shapiro-Wilk test by calling the scipy stats.shapiro() method
- This control tests the null hypothesis that the data was drawn from a normal distribution and returns the test statistic ('W') and the probability ('p').
- The normality criterion holds true when p > a (where a is the probability threshold usually set to 0.05)
- Important: be sure to call the dropna() method on your data set to drop NaN values during testing
In [3]:
# Shapiro-Wilk normality test for Control group
stats.shapiro(data.Control.dropna())
Out[3]:
In [4]:
# Shapiro-Wilk normality test for Treatment group
stats.shapiro(data.Treatment.dropna())
Out[4]:
- Since p > 0.05 for both data sets, they both conform to the normality criterion
- (b) Variance
- To test for variance, apply the Levene test by calling the scipy stats.levene() method
- This control tests tests the null hypothesis that all samples come from populations with equal variances. It returns the test statistic ('W') and the probabilyt ('p').
- The variance criterion holds true when p > a (where a is the probability threshold usually set to 0.05)
In [6]:
# Levene variance test for Control and Treatment groups
stats.levene(data.Control.dropna(), data.Treatment.dropna())
Out[6]:
- As p > 0.05 the data sets conform to the variance criterion
1. Normality & Variance criteria: True
- Independent of the sample sizes when the norm/var criteria hold true then you can proceed and apply the t-test control by calling the scipy stats.ttest_ind() method on your data, as shown below.
- As expected, the method returns the value of the statistic (t) and the probability value (p)
In [7]:
t, p = stats.ttest_ind(data.Control.dropna(), data.Treatment.dropna())
t, p
Out[7]:
Interpretation of the outcome
- Since p < a (0.05) we say that the null hypothesis is rejected and suggest an alternative: "background music does have a significant impact on students' learning". Since the mean of the treatment group is bigger than control the conclusion is that b.m. favors learning.
2. Unequal variances
- In case of unequal variances a better option is to call the ttest_ind() method by passing the argument equal_var = False
In [8]:
t, p = stats.ttest_ind(data.Control.dropna(), data.Treatment.dropna(), equal_var = False)
- In this case a modification of Student's t test is applied known as Welch's t-test
- Read more about Welch's t-test @wikipedia
3. Normality criterion violated - The Mann Whitney U test
- When the normality criterion is violated (samples do not come from normal distributions) then non-parametric statistical control should be applied.
- Non-parametric statistics are a branch of statistics making no assumptions about the probability distributions of the variables. Read about non-parametric statistics@wikipedia
- Mann-Whitney U test is the non-parametric counterpart of the t-test, making no assumption of normal distributions.
- You can apply the Mann-Whitney U test by calling the scipy stats.mannwhitneyu() method (see the scipy docs on stats.mannwhitneyu())
- However, before turning to non-parametric controls you should consult a statistician. It might be the case that your sample data is large enough to apply parametric t-test although the normality criterion is violated.
- A useful table demonstrating the parametric vs. non-parametric statistical controls and suggesting selection criteria is available at: 'location test'@wikipedia
About one- and two-tailed t-test:
These terms refer to whether we statistically explore the possibility that null hypothesis is rejected because the independent variable has either positive or negative impact on the outcome. That is, we do not care about the direction of impact (graph A in the fig. below).
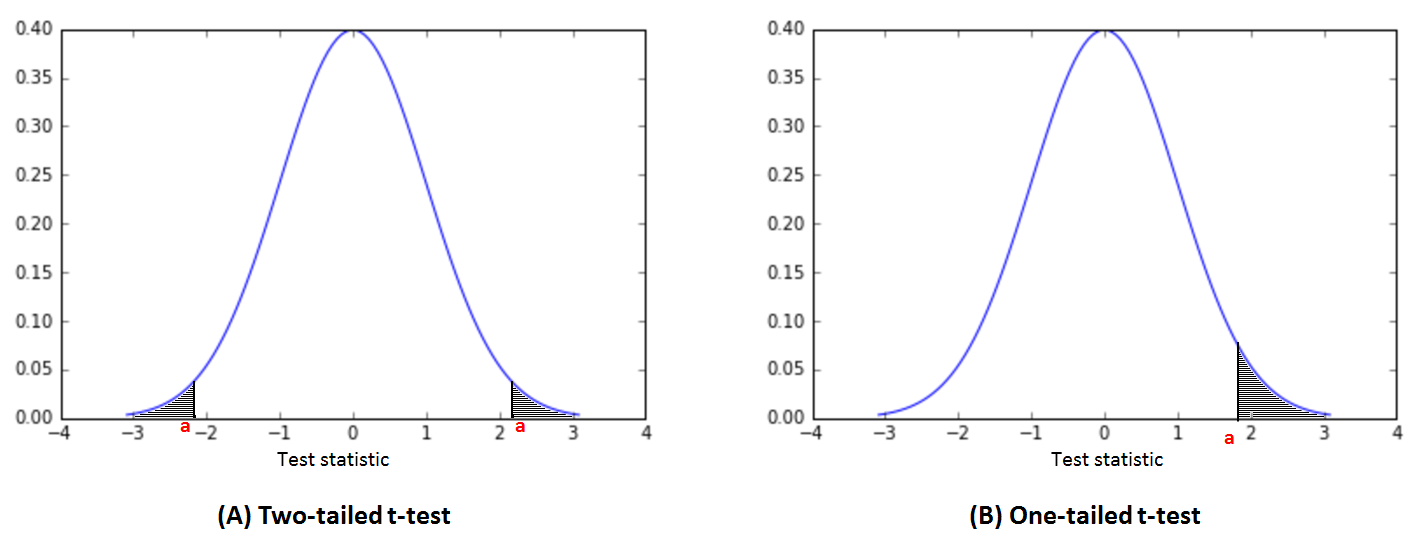
- Sometimes you maybe puzzled as to whether one- or two- tailed test is appropriate for your experiment. The simple question is: always perform two-tailed test, as most other tests apart from t-test (such as the powerful F-tests, chi tests, etc.) are not appropriate for directional testing because of the non-symmetrical shape of the distribution. Thinking about selecting between one- and two-tailed tests is a loss of time.
- Remember that all statistical packages by default return the p-value for two-tailed t-test.
- If, however, you would like to know more about this issue this is a nice place to start reading

Copyright
 . Free learning material
. See full copyright and disclaimer notice