
Prev: Write your own ANOVA function | Next: Two way ANOVA (factorial)
Repeated measures ANOVA
- In this section you will learn what is and when to apply a repeated measures ANOVA and again I will show you how to write and use a relevant function.
Understanding 'Repeated measures' ANOVA
- Repeated measures (or "within subjects") ANOVA is the ANOVA counterpart of the 'paired sample' t-test.
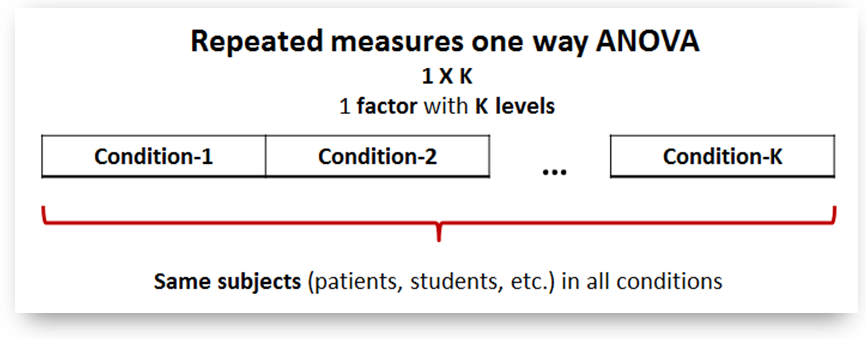
- We apply a repeated measures ANOVA (or 'rANOVA') when the dependent variable is measured for the same subjects (patients, students, etc.) at different times or under different conditions.
A repeated measures ANOVA scenario
- We go on with our 'background music' scenario: Suppose you want to measure the subjective impression that students have about how helpful various genres of music are when played as background during their study. You decide to test three genres: 'Rock music', 'Classic music', 'Jazz music'. As the participants are only a few (N=30) you decide to engage them as one group in all three conditions as follows:
- IV: Background music (three conditions/treatments: 1) rock, 2) classic, 3) jazz
- DV: Students' preference as measured by a standard questionnaire (continuous variable, scale 0-20)
- Population: students of specific age and knowledge background studying in a multimedia elearning environment.
- Research Design: Repeated measures design
- Groups: One group (N = 30) engaged in all three conditions
- Null hypothesis H0 = "Students' preference will be the same independent of the background music genre"
Understanding repeated measures ANOVA
- As before rANOVA investigates the null hypothesis that the mean values in K conditions are statistically not different from each other.
- H0: M1 = M2 = ... = Mk
- ...and the alternative hypothesis is that there exists at least a pair of means which are significantly different.
- To test the above hypothesis ANOVA follows the general noise/signal pattern and computes the F statistic based on the following formula:

Remember now that in general the ANOVA F statistic is computed as:
          MS between groups
  F = ----------------------
          MS within groups
However, in this case, the denominator "MS within groups" needs to be further analyzed in more components.
- The rANOVA however follows a similar but slightly different rationale:
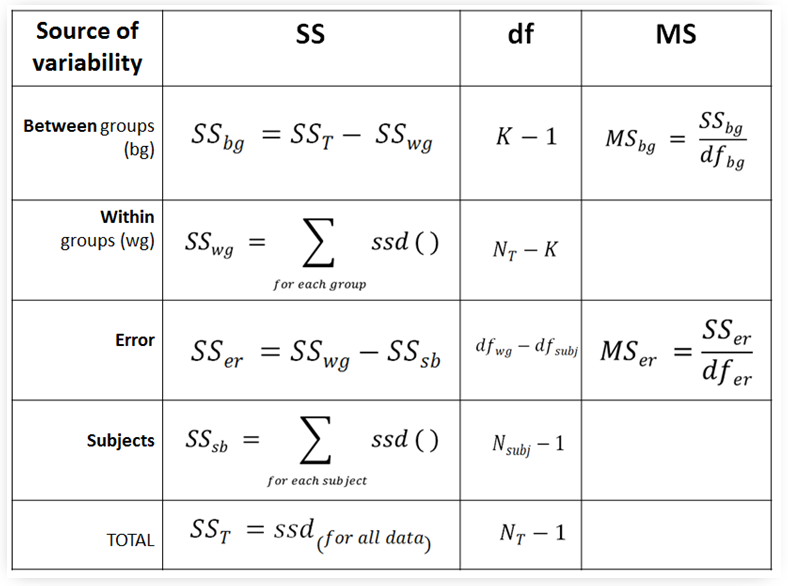
- The total variability SST is again expressed as the sum of SSbetween groups + SSwithin groups
- However, now the SSwithin_groups factor is seen as composed by two other factors:
- SSwg = SSsubjects + SSerror
where: - SSsubjects is the variability due to different subjects, and
- SSerror is the variability within groups due to uncontrollable factors
- SSwg = SSsubjects + SSerror
- In independepnt sample one way ANOVA we would not care about this split since we had different subjects in the various groups. In rANOVA we need to compute the SSsubjects as the subjects are the same in all treatments and subtract it from SSwg.
- Therefore, in rANOVA as denominator in the F ratio, we have: SSerror = SSwg - SSsubjects
- Considering the above the rANOVA is computed by the formula:
ptl_anovaR(): a function for repeated measures ANOVA
- Below is the ptl_anovaR() function for implementing repeated measures anova on input data.
- With the help of the ssd() function we are going to compute the quantities in the following anovaR table
- The function docstring provides documentation for input data (inframe) and output (F, p).
- As before the use of 'vectorized' objects (for example, 'data' and 'datcol') makes obsolete the use of loops in many situations.
In [17]:
# import numpy as np
import pandas as pd
from scipy.stats import f

def ssd(ser):
    '''
    Function ssd(): computes the sum of squared deviates for a Series object

    > Input parameters:
    - ser: the Series object

    > Returns:
    - The sum of squared deviates computed as Σ(x)**2 - ((Σx)**2)/N
    '''
    ser.dropna(axis=0, inplace=True)     # Clear Series from null values 'in place'
    s1 = pow(ser,2).sum()
    s2 = pow(ser.sum(),2) / ser.size
    return s1-s2


def dftoser(df):
    '''
    Function dftoser(): converts a DataFrame to a Series appending all columns in place

    > Input parameters:
    - df: the DataFrame object to be converted

    > Returns:
    - A Series object containing all DataFrame columns one after another
    '''
    # Clear DataFrame from null values 'in place' and possibly drop 'all NaN' rows or columns
    df.dropna(axis=(0,1),how='all',inplace=True)

    ser = pd.Series()
    for i in range(len(df.columns)):
        ser = ser.append(df.iloc[:,i])
    return ser


def ptl_anovaR(inframe):
    '''
    Function:  ptl_anovaR() for performing repeated measures one way anova on input data

    > Input parameters:
    - inframe: pandas DataFrame with data groups in columns (one column for each group)

    > Returns:
    - F: the F statistic for the input data
    - p: the p probability for statistical significance
    '''


    # Number of rows and columns in the input DataFrame
    rows, cols = inframe.shape
    k = cols                     # Columns are also equal to the different groups k
    n_sbj = rows                 # Rows are also equal to the umber of different subjects n_sbj

    # Convert dataframe to a series object
    allser = dftoser(inframe)
    n_t = allser.size            # n_t is the total number of data (measurements)


    # Compute ss_t (sum of squared deviates for the whole data set)
    ss_t = ssd(allser)


    # Compute ss_wg as sum of ss for all sample groups ( = columns in the 'inframe' DataFrame)
    ss_wg = 0
    for i in range(k):
        ss_wg += ssd(inframe.iloc[:,i])

    # OK Compute ss_bg by subtracking ss_wg from ss_t
    ss_bg = ss_t - ss_wg

    # Construct a new Series object: "subjectmeans" (contains the means for each subject data)
    subjmeans = pd.Series([0 for i in range(rows)])
    for i in range(rows):
        sm = inframe.iloc[i,:].mean(skipna=True)
        subjmeans.iloc[i] = sm

    # Compute ss_sb as the weighed (by groups) ssd for the subjmeans object
    ss_sb = k*ssd(subjmeans)
    ss_er = ss_wg - ss_sb

    # degrees of freedom
    df_t = n_t - 1
    df_bg = k - 1
    df_wg = n_t - k
    df_sb = n_sbj - 1
    df_er = df_wg - df_sb

    ms_bg = ss_bg / df_bg
    ms_er = ss_er / df_er

    F = ms_bg / ms_er
    p = f.sf(F, df_bg, df_er, loc=0, scale=1)

    # Printouts
    print('Between groups (effect):\t SS_bg = {:8.4f}, \t df_bg = {:3d}, \t MS_bg = {:8.4f}'.format(ss_bg, df_bg, ms_bg))
    print('          Within groups:\t SS_wg = {:8.4f}, \t df_wg = {:3d}'.format(ss_wg, df_wg))
    print('                  Error:\t SS_er = {:8.4f}, \t df_er = {:3d}, \t MS_er = {:8.4f}'.format(ss_er, df_er, ms_er))
    print('               Subjects:\t SS_sb = {:8.4f}, \t df_sb = {:3d}'.format(ss_sb, df_sb))
    print('                  TOTAL:\t  SS_t = {:8.4f}, \t  df_t = {:3d}'.format(ss_t, df_t))
    print('F = {:8.4f}, p = {:8.4f}'.format(F, p))

    return F, p


# Main ========================================================================

# ALTERNATIVE-1: Pre-set data for validating the 'repeated measures ANOVA' code
# These data are copied from http://vassarstats.net/textbook/index.html

# testdata = {'G0':[35,32,33,32,31,29,29,27,27,28,27,27,24,24,17,17,14,13],
#             'G1':[39,35,32,32,33,30,31,29,31,27,27,26,29,25,16,15,15,13],
#             'G2':[32,31,28,29,26,29,27,27,24,24,23,23,19,19,18,17,12,13]
#             }

#=============================================================================
# ALTERNATIVE-2: Read data from file
testdata = pd.read_excel('../../data/researchdata.xlsx', sheetname="anovaR")

F, p = ptl_anovaR(pd.DataFrame(testdata))
Download
- Download the ptl_anovaR() code as .py file

Copyright
 . Free learning material
. See full copyright and disclaimer notice